Average Household Budget in America of September 2026

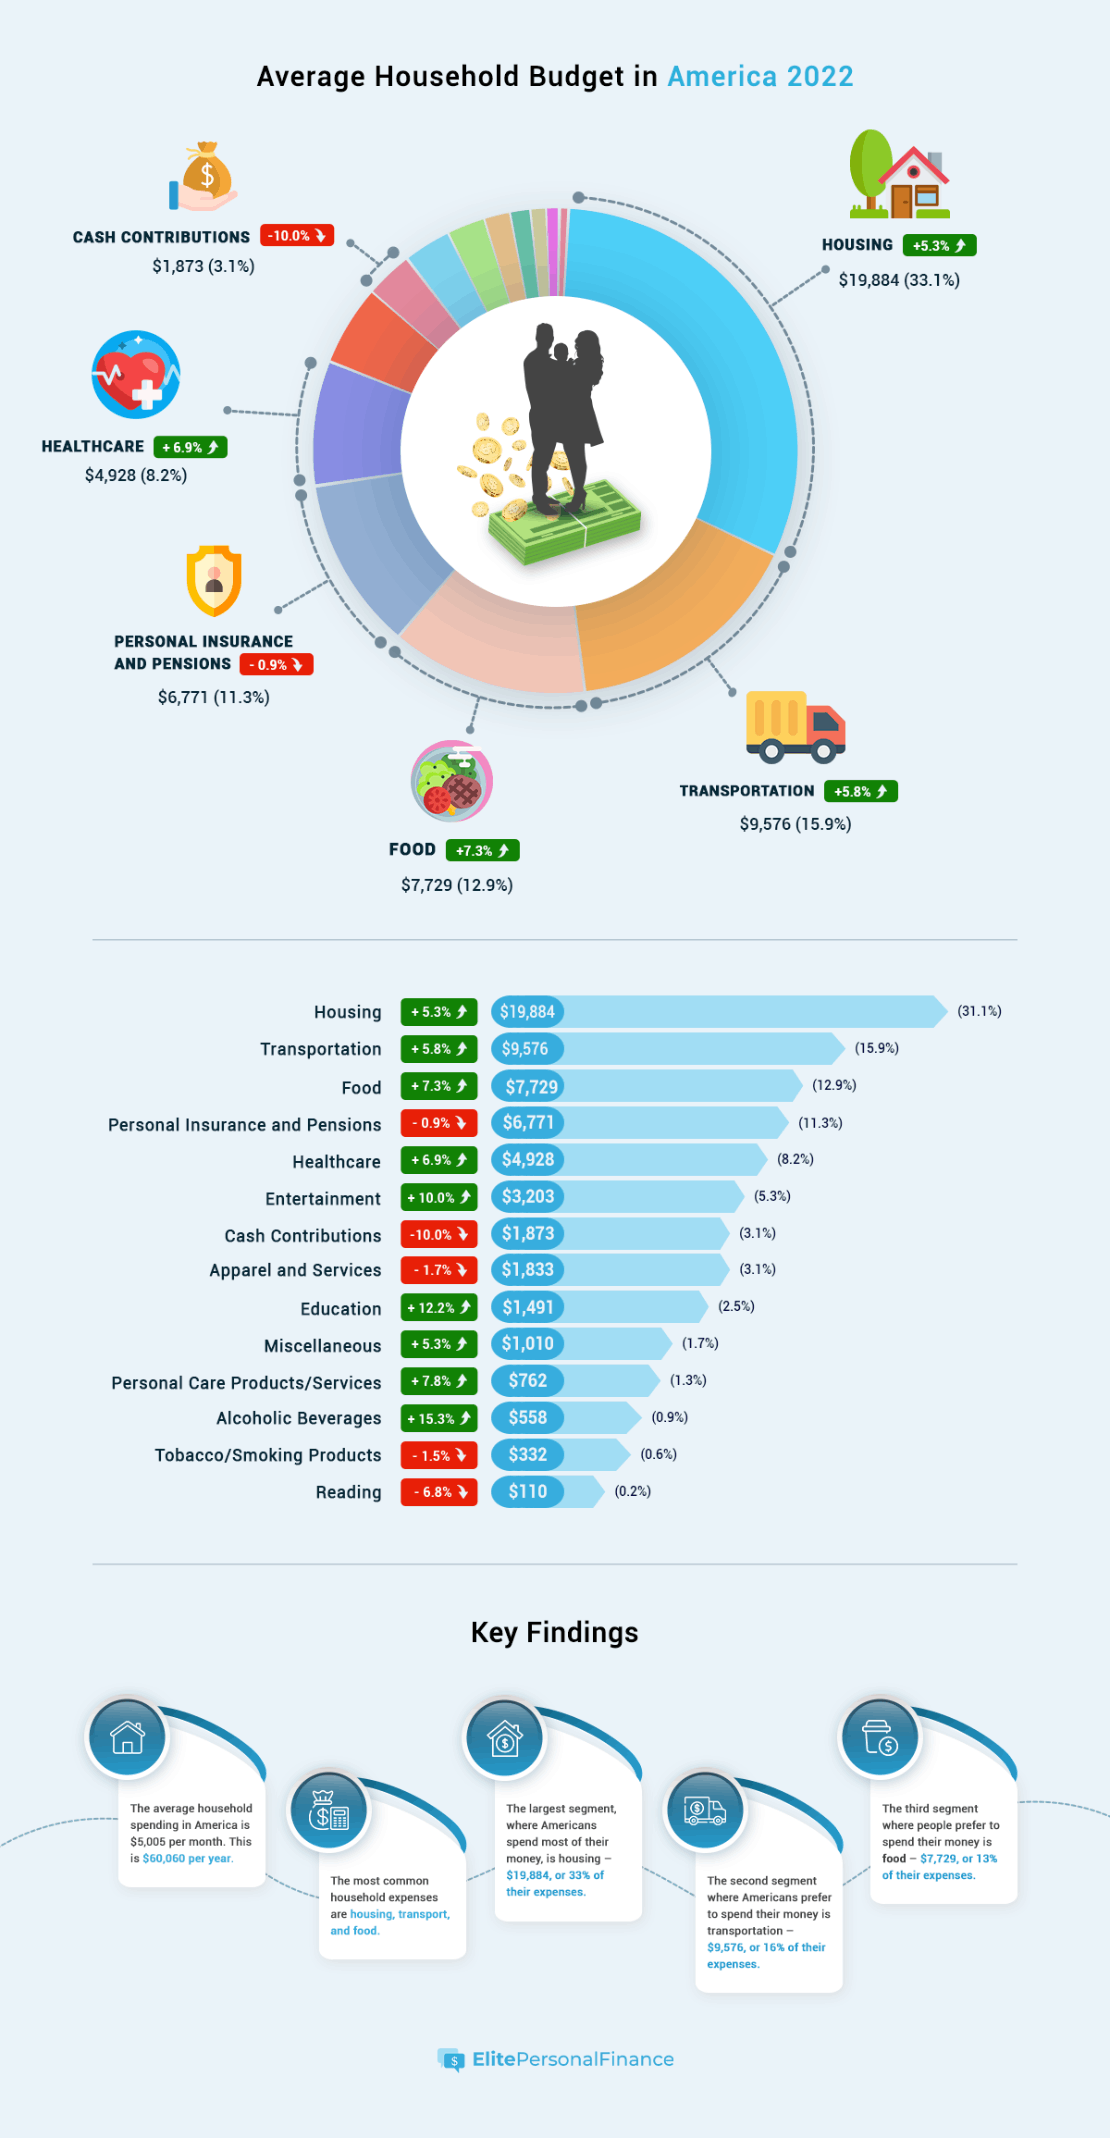
The results are in, and Americans’ average annual household expenditures totaled $61,334 in 2020. And while the metric declined year-over-year (YoY), Americans’ average pre-tax household income increased to $84,352.
To explain, the U.S. Bureau of Labor Statistics (BLS) latest Consumer Expenditures Survey shows that Americans’ average pre-tax income increased by 1.8% YoY in 2020, while Americans’ average household expenditures decreased by 2.7% YoY.
However, will Americans household expenses likely increase in 2021? And how did the pandemic impact the BLS’ findings? Read on for more information.

Average Household Budget and Expenses in America of September 2026: Statistics and Key Findings

Americans’ average pre-tax income increased by 1.8% YoY in 2020, while Americans’ average household expenditures decreased by 2.7% YoY.
Americans’ expenditures at restaurants declined by 32.6% YoY in 2020, while alcoholic beverages fell by 17.4% YoY, clothing fell by 23.8% YoY, and public transportation plunged by 66.3% YoY. Conversely, Americans’ expenditures on reading materials increased by 23.9% YoY, while spending on homemade meals increased by 6.4% YoY.
Americans allocated the highest proportion of their average pre-tax household income (APTHI) to housing (25.4%), transportation (11.6%), and food (8.7%). Conversely, Americans allocated the lowest proportion of their APTHI to reading materials (0.1%), tobacco and cigarettes (0.4%), and alcoholic beverages (0.6%).
Americans’ average annual household expenditures have increased by a 2.30% CAGR from the end of 2014 until the end of 2020.
Americans’ spending on cash contributions (4.16%), pensions/insurance (4.0%), and healthcare (3.18%) recorded the highest increases over the last six years. Conversely, Americans’ spending on clothing (-3.59%), tobacco and cigarettes (-0.21%), and personal care products/services (0.03%) recorded the lowest increases over the last six years.
By Region:
Households in the northeast ($95,329) and the west ($91,964) earn the highest APTHI in the United States.
Average annual household spending in the northeast and the west are more than $10,000 higher than in the south, and both regions also spend over $7,000 more than similar households in the midwest.
By State:
Americans in Hawaii ($2,731), New Jersey ($2,562), and California ($2,529) incur the highest monthly expenses in the U.S, while Americans in West Virginia ($1,485), Arkansas ($1,534), and Mississippi ($1,567) incur the lowest monthly expenses in the U.S.
Americans in Louisiana (45.0%), Florida (42.0%), and Montana (42.0%) allocate the highest proportion of their monthly household incomes to bill payments, while Americans in Utah (32.0%), Nebraska (33.0%), and Virginia (33.0%) allocate the lowest proportion of their monthly household incomes to bill payments.
By Family Size:
Two-person American households generate APTHI that’s 2.13x one-person households.
Only life insurance and pension outlay (2.28x) for two-person households are more than double their one-person counterparts. Healthcare (1.93x), entertainment (1.91x), and transportation (1.88x) are near the 2x threshold.
Four-person families only spend 81% of what two-person households spend on alcoholic beverages, and they only spend 84% of what two-person families spend on reading. Likewise, four-person households (0.96x) spend less on healthcare than two-person households.
By Income:
Americans that earn $29,999 or less per year allocate roughly 43% of their annual budgets to housing. Conversely, Americans that earn $100,000 or more per year allocate approximately 32% of their yearly budgets to housing.
Transportation costs for Americans that earn $50,000 to $69,999 per year are 18.0% of their household budgets. Conversely, transportation costs for Americans that make $200,000 or more per year are only 13.3% of their household budgets.
Americans that earn $150,000 to $199,999 per year allocate 1.2% of their household budgets to alcoholic beverages, while Americans that earn $30,000 to $39,000 per year only allocate 0.5% of their household budgets to alcoholic drinks.
Americans that make $200,000 or more per year allocate 5.3% of their household budgets to entertainment, while Americans that earn $50,000 to $69,999 per year only allocate 3.9% of their household budgets to entertainment.
By Gender:
Single men have APTHI of $48,994, while single women have APTHI of $35,530.
The average single male spends $40,350 per year to finance his lifestyle, while the average single female spends $37,100 to fund hers.
Single men spend 2.04x and 2.02x single women on tobacco products and alcoholic beverages.
Single men only spend 41%, 65%, and 77% of what single women spend on personal care, reading materials, and healthcare.
By Race:
Black Americans made up 12.4% of the U.S. population in 2020. However, Black Americans only exceeded 12.4% of the consolidated average household expenditures in apparel and services at 12.5%.
Hispanic Americans made up 18.7% of the U.S. population in 2020. However, their share of consolidated household spending in all categories is below their population average.
Asian Americans made up 6% of the U.S. population in 2020. And Asian Americans account for 10.8% of consolidated household spending on education — well above their population average.
Average Household Budget and Expenses in America of September 2026: Charts, Graph, Analysis
Average Household Expenses in America of September 2026
With COVID-19 forcing Americans to change their spending habits, pandemic-related weakness was present in leisure, hospitality, and entertainment expenditures.
For example, the BLS data shows that Americans’ expenditures at restaurants declined by 32.6% YoY in 2020. Similarly, alcoholic beverages fell by 17.4% YoY, clothing fell by 23.8% YoY, and public transportation plunged by 66.3% YoY. Conversely, Americans’ expenditures on reading materials increased by 23.9% YoY, while spending on homemade meals increased by 6.4% YoY.
As expected, Americans allocated the highest proportion of their average pre-tax household income (APTHI) to housing (25.4%), transportation (11.6%), and food (8.7%). Conversely, Americans allocated the lowest proportion of their APTHI to reading materials (0.1%), tobacco and cigarettes (0.4%), and alcoholic beverages (0.6%).
| Average Annual Household Expenditure: | 2018: | 2019: | 2020: | Average Per Month: | Change: | % of APTHI: |
|---|---|---|---|---|---|---|
| Average Annual Household Expenditure:Housing | 2018:20,091 | 2019:20,679 | 2020:21,409 | Average Per Month:1784 | Change:3.5% | % of APTHI:25.4% |
| Average Annual Household Expenditure:Shelter | 2018:11,747 | 2019:12,190 | 2020:12,604 | Average Per Month:1050 | Change:3.4% | % of APTHI:14.9% |
| Average Annual Household Expenditure:Transportation | 2018:9,761 | 2019:10,742 | 2020:9,826 | Average Per Month:819 | Change:-8.5% | % of APTHI:11.6% |
| Average Annual Household Expenditure:Owned dwellings | 2018:6,678 | 2019:6,797 | 2020:7,473 | Average Per Month:623 | Change:9.9% | % of APTHI:8.9% |
| Average Annual Household Expenditure:Food | 2018:7,923 | 2019:8,169 | 2020:7,316 | Average Per Month:610 | Change:-10.4% | % of APTHI:8.7% |
| Average Annual Household Expenditure:Personal insurance and pensions | 2018:7,296 | 2019:7,165 | 2020:7,246 | Average Per Month:604 | Change:1.1% | % of APTHI:8.6% |
| Average Annual Household Expenditure:Pensions and Social Security | 2018:6,831 | 2019:6,645 | 2020:6,760 | Average Per Month:563 | Change:1.7% | % of APTHI:8.0% |
| Average Annual Household Expenditure:Healthcare | 2018:4,968 | 2019:5,193 | 2020:5,177 | Average Per Month:431 | Change:-0.3% | % of APTHI:6.1% |
| Average Annual Household Expenditure:Food at home | 2018:4,464 | 2019:4,643 | 2020:4,942 | Average Per Month:412 | Change:6.4% | % of APTHI:5.9% |
| Average Annual Household Expenditure:Vehicle purchases (net outlays) | 2018:3,975 | 2019:4,394 | 2020:4,523 | Average Per Month:377 | Change:2.9% | % of APTHI:5.4% |
| Average Annual Household Expenditure:Rented dwellings | 2018:4,249 | 2019:4,432 | 2020:4,408 | Average Per Month:367 | Change:-0.5% | % of APTHI:5.2% |
| Average Annual Household Expenditure:Health insurance | 2018:3,405 | 2019:3,529 | 2020:3,667 | Average Per Month:306 | Change:3.9% | % of APTHI:4.3% |
| Average Annual Household Expenditure:Entertainment | 2018:3,226 | 2019:3,050 | 2020:2,912 | Average Per Month:243 | Change:-5.8% | % of APTHI:3.5% |
| Average Annual Household Expenditure:Food away from home | 2018:3,459 | 2019:3,526 | 2020:2,375 | Average Per Month:198 | Change:-32.6% | % of APTHI:2.8% |
| Average Annual Household Expenditure:Cash contributions | 2018:1,888 | 2019:1,995 | 2020:2,283 | Average Per Month:190 | Change:14.4% | % of APTHI:2.7% |
| Average Annual Household Expenditure:Gasoline, other fuels, and motor oil | 2018:2,109 | 2019:2,094 | 2020:1,568 | Average Per Month:131 | Change:-25.1% | % of APTHI:1.9% |
| Average Annual Household Expenditure:Household operations | 2018:1,522 | 2019:1,570 | 2020:1,465 | Average Per Month:122 | Change:-6.7% | % of APTHI:1.7% |
| Average Annual Household Expenditure:Apparel and services | 2018:1,866 | 2019:1,883 | 2020:1,434 | Average Per Month:120 | Change:-23.8% | % of APTHI:1.7% |
| Average Annual Household Expenditure:Education | 2018:1,407 | 2019:1,443 | 2020:1,271 | Average Per Month:106 | Change:-11.9% | % of APTHI:1.5% |
| Average Annual Household Expenditure:Miscellaneous | 2018:993 | 2019:899 | 2020:907 | Average Per Month:76 | Change:0.9% | % of APTHI:1.1% |
| Average Annual Household Expenditure:Medical services | 2018:909 | 2019:984 | 2020:864 | Average Per Month:72 | Change:-12.2% | % of APTHI:1.0% |
| Average Annual Household Expenditure:equipment | 2018:816 | 2019:821 | 2020:859 | Average Per Month:72 | Change:4.6% | % of APTHI:1.0% |
| Average Annual Household Expenditure:Housekeeping supplies | 2018:747 | 2019:766 | 2020:837 | Average Per Month:70 | Change:9.3% | % of APTHI:1.0% |
| Average Annual Household Expenditure:Personal care products and services | 2018:768 | 2019:786 | 2020:646 | Average Per Month:54 | Change:-17.8% | % of APTHI:0.8% |
| Average Annual Household Expenditure:equipment, and services | 2018:614 | 2019:389 | 2020:579 | Average Per Month:48 | Change:48.8% | % of APTHI:0.7% |
| Average Annual Household Expenditure:Other household supplies | 2018:431 | 2019:458 | 2020:536 | Average Per Month:45 | Change:17.0% | % of APTHI:0.6% |
| Average Annual Household Expenditure:Alcoholic beverages | 2018:583 | 2019:579 | 2020:478 | Average Per Month:40 | Change:-17.4% | % of APTHI:0.6% |
| Average Annual Household Expenditure:Fees and admissions | 2018:766 | 2019:880 | 2020:425 | Average Per Month:35 | Change:-51.7% | % of APTHI:0.5% |
| Average Annual Household Expenditure:Personal services | 2018:472 | 2019:489 | 2020:347 | Average Per Month:29 | Change:-29.0% | % of APTHI:0.4% |
| Average Annual Household Expenditure:Tobacco products and smoking supplies | 2018:347 | 2019:320 | 2020:315 | Average Per Month:26 | Change:-1.6% | % of APTHI:0.4% |
| Average Annual Household Expenditure:Public and other transportation | 2018:818 | 2019:781 | 2020:263 | Average Per Month:22 | Change:-66.3% | % of APTHI:0.3% |
| Average Annual Household Expenditure:Medical supplies | 2018:172 | 2019:194 | 2020:170 | Average Per Month:14 | Change:-12.4% | % of APTHI:0.2% |
| Average Annual Household Expenditure:Reading | 2018:108 | 2019:92 | 2020:114 | Average Per Month:10 | Change:23.9% | % of APTHI:0.1% |
| Average Annual Household Expenditure:Total Average Annual Household Expenditures | 2018:$61,224 | 2019:$63,036 | 2020:$61,334 | Average Per Month:$5,111 | Change:-2.7% | % of APTHI: |
| Average Annual Household Expenditure:Average Pre-Tax Household Income | 2018:$78,635 | 2019:$82,852 | 2020:$84,352 | Average Per Month:$7,029 | Change:1.8% | % of APTHI: |
Historical Average U.S. Household Spending
When smoothing out the data over several years, American wage growth had been outpacing inflation. For example, from the end of 2014 until the end of 2020, average hourly earnings increased at a compound annual growth rate (CAGR) of 3.28%. And lagging the metric, the headline U.S. Consumer Price Index (CPI) rose by a 1.71% CAGR during that same timeframe.
As a result, real (inflation-adjusted) wages in the U.S. grew at a 1.57% CAGR before the pandemic. In a nutshell: the data means that Americans’ incomes had been outpacing their cost of living. And while Americans’ average annual household expenditures have increased by a 2.30% CAGR from the end of 2014 until the end of 2020, real incomes were still in pole position.
However, with the BLS revealing on Dec. 10 that real average hourly earnings declined by 1.9% YoY, inflation now has the upper hand. And while all of the recent price increases will likely elicit a YoY rise in the BLS’ mid-year Consumer Expenditures Survey, how has the data stacked up over the last six years?
| Average Annual Household Expenditure: | 2014: | 2015: | 2016: | 2017: | 2018: | 2019: | 2020: | $ Up/Down: |
|---|---|---|---|---|---|---|---|---|
| Average Annual Household Expenditure:Housing | 2014:17,798 | 2015:18,409 | 2016:18,886 | 2017:19,884 | 2018:20,091 | 2019:20,679 | 2020:21,409 | $ Up/Down:730 |
| Average Annual Household Expenditure:Transportation | 2014:9,073 | 2015:9,503 | 2016:9,049 | 2017:9,576 | 2018:9,761 | 2019:10,742 | 2020:9,826 | $ Up/Down:-916 |
| Average Annual Household Expenditure:Food | 2014:6,759 | 2015:7,023 | 2016:7,203 | 2017:7,729 | 2018:7,923 | 2019:8,169 | 2020:7,316 | $ Up/Down:-853 |
| Average Annual Household Expenditure:Personal insurance and pensions | 2014:5,726 | 2015:6,349 | 2016:6,831 | 2017:6,771 | 2018:7,296 | 2019:7,165 | 2020:7,246 | $ Up/Down:81 |
| Average Annual Household Expenditure:Healthcare | 2014:4,290 | 2015:4,342 | 2016:4,612 | 2017:4,928 | 2018:4,968 | 2019:5,193 | 2020:5,177 | $ Up/Down:-16 |
| Average Annual Household Expenditure:Entertainment | 2014:2,728 | 2015:2,842 | 2016:2,913 | 2017:3,203 | 2018:3,226 | 2019:3,050 | 2020:2,912 | $ Up/Down:-138 |
| Average Annual Household Expenditure:Cash contributions | 2014:1,788 | 2015:1,819 | 2016:2,081 | 2017:1,873 | 2018:1,888 | 2019:1,995 | 2020:2,283 | $ Up/Down:288 |
| Average Annual Household Expenditure:Apparel and services | 2014:1,786 | 2015:1,846 | 2016:1,803 | 2017:1,833 | 2018:1,866 | 2019:1,883 | 2020:1,434 | $ Up/Down:-449 |
| Average Annual Household Expenditure:Education | 2014:1,236 | 2015:1,315 | 2016:1,329 | 2017:1,491 | 2018:1,407 | 2019:1,443 | 2020:1,271 | $ Up/Down:-172 |
| Average Annual Household Expenditure:Miscellaneous | 2014:782 | 2015:871 | 2016:959 | 2017:1,010 | 2018:993 | 2019:899 | 2020:907 | $ Up/Down:8 |
| Average Annual Household Expenditure:Personal care products/services | 2014:645 | 2015:683 | 2016:707 | 2017:762 | 2018:768 | 2019:786 | 2020:646 | $ Up/Down:-140 |
| Average Annual Household Expenditure:Alcoholic beverages | 2014:463 | 2015:515 | 2016:484 | 2017:558 | 2018:583 | 2019:579 | 2020:478 | $ Up/Down:-101 |
| Average Annual Household Expenditure:Tobacco/smoking products | 2014:319 | 2015:349 | 2016:337 | 2017:332 | 2018:347 | 2019:320 | 2020:315 | $ Up/Down:-5 |
| Average Annual Household Expenditure:Reading | 2014:103 | 2015:114 | 2016:118 | 2017:110 | 2018:108 | 2019:92 | 2020:114 | $ Up/Down:22 |
| Average Annual Household Expenditure:Total Average Annual Household Expenditures | 2014:$53,496 | 2015:$55,980 | 2016:$57,312 | 2017:$60,060 | 2018:$61,224 | 2019:$63,036 | 2020:$61,334 | $ Up/Down:-$1,702 |
Outpacing the household average, Americans’ spending on cash contributions (4.16%) — which includes outlays like child support, family care, and political/religious donations — pensions/insurance (4.0%), and healthcare (3.18%) recorded the highest increases over the last six years.
On the flip side, Americans’ spending on clothing (-3.59%), tobacco and cigarettes (-0.21%), and personal care products/services (0.03%) recorded the lowest increases over the last six years.
Average U.S. Household Spending by Region
With households in the northeast ($95,329) and the west ($91,964) earning the highest APTHI in the United States, their spending habits are also more extravagant. For example, average annual household spending in the northeast and the west are more than $10,000 higher than in the south. Likewise, both regions also spend over $7,000 more than similar households in the midwest.
Furthermore, households in the northeast and the west also spend more on housing and food than their southern and midwestern counterparts. Conversely, Americans in the south and the midwest allocate higher proportions of their household budgets to transportation and healthcare.
For example, Americans in the northeast and the west allocate 13.2% and 15.2% of their household budgets to transportation. However, Americans in the south and the midwest allocate 17.5% and 17.2%, respectively. Similarly, Americans in the northeast and the west allocate 7.3% and 7.4% of their household budgets to healthcare. However, Americans in the south and the midwest allocate 9.1% and 9.6%, respectively.
| Average Annual Household Expenditure: | Total: | Northeast: | Midwest: | South: | West: |
|---|---|---|---|---|---|
| Average Annual Household Expenditure:Food | Total:7,316 | Northeast:8,294 | Midwest:6,921 | South:6,477 | West:8,398 |
| Average Annual Household Expenditure:Alcoholic beverages | Total:478 | Northeast:587 | Midwest:500 | South:382 | West:539 |
| Average Annual Household Expenditure:Housing | Total:21,409 | Northeast:25,195 | Midwest:19,268 | South:19,029 | West:24,548 |
| Average Annual Household Expenditure:Apparel and services | Total:1,434 | Northeast:1,800 | Midwest:1,515 | South:1,191 | West:1,496 |
| Average Annual Household Expenditure:Transportation | Total:9,826 | Northeast:9,035 | Midwest:10,281 | South:9,745 | West:10,146 |
| Average Annual Household Expenditure:Healthcare | Total:5,177 | Northeast:5,006 | Midwest:5,739 | South:5,098 | West:4,916 |
| Average Annual Household Expenditure:Entertainment | Total:2,912 | Northeast:3,113 | Midwest:3,368 | South:2,378 | West:3,242 |
| Average Annual Household Expenditure:Personal care products/services | Total:646 | Northeast:659 | Midwest:673 | South:568 | West:747 |
| Average Annual Household Expenditure:Reading | Total:114 | Northeast:128 | Midwest:113 | South:106 | West:116 |
| Average Annual Household Expenditure:Education | Total:1,271 | Northeast:2,368 | Midwest:937 | South:1,069 | West:1,082 |
| Average Annual Household Expenditure:Tobacco products/smoking products | Total:315 | Northeast:313 | Midwest:347 | South:339 | West:246 |
| Average Annual Household Expenditure:Miscellaneous | Total:907 | Northeast:1,098 | Midwest:808 | South:816 | West:1,007 |
| Average Annual Household Expenditure:Cash contributions | Total:2,283 | Northeast:2,632 | Midwest:2,197 | South:2,008 | West:2,561 |
| Average Annual Household Expenditure:Personal insurance and pensions | Total:7,246 | Northeast:8,367 | Midwest:7,000 | South:6,591 | West:7,724 |
| Average Annual Household Expenditure:Total Average Annual Household Expenditures | Total:$61,334 | Northeast:$68,596 | Midwest:$59,667 | South:$55,797 | West:$66,769 |
Average U.S. Household Spending by State
Breaking down the data by state, Doxo — an online platform that helps Americans streamline their monthly bill payments — analyzed consumers’ spending habits across more than 30,000 zip codes.
For context, Doxo compared Americans’ monthly expenses to their incomes in each state to determine the most affordable and least affordable jurisdictions. In addition, the data tracks the regular monthly outlays that confront most Americans: mortgage payments, rent, utility payments (like heat electricity, cable, internet, phone), auto and insurance payments, home security, and life/health insurance payments.
To that point, Americans in Hawaii ($2,731), New Jersey ($2,562), and California ($2,529) incur the highest monthly expenses in the U.S. Conversely, Americans in West Virginia ($1,485), Arkansas ($1,534), and Mississippi ($1,567) incur the lowest monthly expenses in the U.S.
However, for a more accurate depiction, it’s essential to analyze Americans’ monthly expenses as a proportion of their monthly incomes. And with Americans in Louisiana (45.0%), Florida (42.0%), and Montana (42.0%) allocating the highest proportion of their monthly household incomes to bill payments, their relative cost of living is the highest in the U.S.
On the flip side, with Americans in Utah (32.0%), Nebraska (33.0%), and Virginia (33.0%) allocating the lowest proportion of their monthly household incomes to bill payments, their relative cost of living is the lowest in the U.S.
| State: | Amount Spent Per Month: | % of Household Income: | % Above/Below the National Average: |
|---|---|---|---|
| State:Hawaii | Amount Spent Per Month:$2,731 | % of Household Income:41.0% | % Above/Below the National Average:44.6% |
| State:New Jersey | Amount Spent Per Month:$2,562 | % of Household Income:36.0% | % Above/Below the National Average:35.7% |
| State:California | Amount Spent Per Month:$2,529 | % of Household Income:39.0% | % Above/Below the National Average:33.9% |
| State:Alaska | Amount Spent Per Month:$2,484 | % of Household Income:38.0% | % Above/Below the National Average:31.5% |
| State:Massachusetts | Amount Spent Per Month:$2,464 | % of Household Income:36.0% | % Above/Below the National Average:30.5% |
| State:Maryland | Amount Spent Per Month:$2,356 | % of Household Income:33.0% | % Above/Below the National Average:24.7% |
| State:Connecticut | Amount Spent Per Month:$2,311 | % of Household Income:34.0% | % Above/Below the National Average:22.3% |
| State:New York | Amount Spent Per Month:$2,252 | % of Household Income:37.0% | % Above/Below the National Average:19.2% |
| State:Washington | Amount Spent Per Month:$2,199 | % of Household Income:36.0% | % Above/Below the National Average:16.4% |
| State:New Hampshire | Amount Spent Per Month:$2,188 | % of Household Income:34.0% | % Above/Below the National Average:15.8% |
| State:Colorado | Amount Spent Per Month:$2,147 | % of Household Income:36.0% | % Above/Below the National Average:13.7% |
| State:Rhode Island, | Amount Spent Per Month:$2,147 | % of Household Income:39.0% | % Above/Below the National Average:13.6% |
| State:Wyoming | Amount Spent Per Month:$2,107 | % of Household Income:41.0% | % Above/Below the National Average:11.5% |
| State:Virginia | Amount Spent Per Month:$2,101 | % of Household Income:33.0% | % Above/Below the National Average:11.2% |
| State:Vermont | Amount Spent Per Month:$2,073 | % of Household Income:41.0% | % Above/Below the National Average:9.8% |
| State:Oregon | Amount Spent Per Month:$2,071 | % of Household Income:40.0% | % Above/Below the National Average:9.6% |
| State:Minnesota | Amount Spent Per Month:$2,007 | % of Household Income:34.0% | % Above/Below the National Average:6.3% |
| State:Florida | Amount Spent Per Month:$1,943 | % of Household Income:42.0% | % Above/Below the National Average:2.9% |
| State:Illinois | Amount Spent Per Month:$1,934 | % of Household Income:34.0% | % Above/Below the National Average:2.4% |
| State:Nevada | Amount Spent Per Month:$1,928 | % of Household Income:39.0% | % Above/Below the National Average:2.1% |
| State:Wisconsin | Amount Spent Per Month:$1,923 | % of Household Income:38.0% | % Above/Below the National Average:1.8% |
| State:Delaware | Amount Spent Per Month:$1,904 | % of Household Income:34.0% | % Above/Below the National Average:0.8% |
| State:Maine | Amount Spent Per Month:$1,900 | % of Household Income:40.0% | % Above/Below the National Average:0.6% |
| State:Texas | Amount Spent Per Month:$1,883 | % of Household Income:36.0% | % Above/Below the National Average:-0.3% |
| State:Utah | Amount Spent Per Month:$1,844 | % of Household Income:32.0% | % Above/Below the National Average:-2.4% |
| State:Montana | Amount Spent Per Month:$1,835 | % of Household Income:42.0% | % Above/Below the National Average:-2.8% |
| State:North Dakota | Amount Spent Per Month:$1,835 | % of Household Income:35.0% | % Above/Below the National Average:-2.9% |
| State:Georgia | Amount Spent Per Month:$1,833 | % of Household Income:38.0% | % Above/Below the National Average:-3.0% |
| State:Louisiana | Amount Spent Per Month:$1,832 | % of Household Income:45.0% | % Above/Below the National Average:-3.0% |
| State:Arizona | Amount Spent Per Month:$1,829 | % of Household Income:37.0% | % Above/Below the National Average:-3.1% |
| State:Iowa | Amount Spent Per Month:$1,789 | % of Household Income:36.0% | % Above/Below the National Average:-5.3% |
| State:North Carolina | Amount Spent Per Month:$1,768 | % of Household Income:39.0% | % Above/Below the National Average:-6.4% |
| State:Pennsylvania | Amount Spent Per Month:$1,767 | % of Household Income:34.0% | % Above/Below the National Average:-6.4% |
| State:Michigan | Amount Spent Per Month:$1,734 | % of Household Income:36.0% | % Above/Below the National Average:-8.2% |
| State:Kansas | Amount Spent Per Month:$1,727 | % of Household Income:34.0% | % Above/Below the National Average:-8.6% |
| State:Idaho | Amount Spent Per Month:$1,698 | % of Household Income:38.0% | % Above/Below the National Average:-10.1% |
| State:South Dakota | Amount Spent Per Month:$1,691 | % of Household Income:36.0% | % Above/Below the National Average:-10.5% |
| State:South Carolina | Amount Spent Per Month:$1,690 | % of Household Income:39.0% | % Above/Below the National Average:-10.5% |
| State:Ohio | Amount Spent Per Month:$1,666 | % of Household Income:35.0% | % Above/Below the National Average:-11.8% |
| State:Tennessee | Amount Spent Per Month:$1,663 | % of Household Income:38.0% | % Above/Below the National Average:-11.9% |
| State:Nebraska | Amount Spent Per Month:$1,663 | % of Household Income:33.0% | % Above/Below the National Average:-12.0% |
| State:Alabama | Amount Spent Per Month:$1,655 | % of Household Income:40.0% | % Above/Below the National Average:-12.4% |
| State:Kentucky | Amount Spent Per Month:$1,622 | % of Household Income:39.0% | % Above/Below the National Average:-14.1% |
| State:Oklahoma | Amount Spent Per Month:$1,619 | % of Household Income:37.0% | % Above/Below the National Average:-14.3% |
| State:Missouri | Amount Spent Per Month:$1,612 | % of Household Income:34.0% | % Above/Below the National Average:-14.7% |
| State:New Mexico | Amount Spent Per Month:$1,608 | % of Household Income:40.0% | % Above/Below the National Average:-14.8% |
| State:Indiana | Amount Spent Per Month:$1,597 | % of Household Income:34.0% | % Above/Below the National Average:-15.5% |
| State:Mississippi | Amount Spent Per Month:$1,567 | % of Household Income:42.0% | % Above/Below the National Average:-17.0% |
| State:Arkansas | Amount Spent Per Month:$1,534 | % of Household Income:40.0% | % Above/Below the National Average:-18.8% |
| State:West Virginia | Amount Spent Per Month:$1,485 | % of Household Income:39.0% | % Above/Below the National Average:-21.4% |
Average U.S. Household Spending by Family Size
As you may have guessed, larger households often incur more expenses. However, BLS data shows that American families with five or more members spend less per year than comparable households with only four members. And while the findings contradict logical expectations, we’ll take the BLS’ word for it.
However, many interesting tidbits of information are still present: for example, two-person American households generate APTHI that’s 2.13x one-person households. In a nutshell: the data means that two-person families have combined annual pre-tax income that’s more than double one-person households.
However, when analyzing their relative expenditures, only life insurance and pension outlay (2.28x) for two-person households are more than double their one-person counterparts. As expected, healthcare (1.93x), entertainment (1.91x), and transportation (1.88x) are near the 2x threshold. Conversely, housing (1.40x) highlights the cost savings that couples achieve relative to single persons.
In addition, exciting findings were also present when comparing two-person households with four-person households. For example, four-person families only spend 81% of what two-person households spend on alcoholic beverages. And with most two-person homes consisting of two adults, while four-person households often include children, the data makes logical sense. Likewise, four-person households (0.96x) spend less on healthcare than two-person households. And with family care bundles likely the main driver of the savings, sometimes more is less.
Finally, the strange outlier is that four-person households only spend 84% of what two-person families spend on reading. With children often present in four-person homes, this metric should be higher.
| Average Annual Household Expenditure: | 1-Per: | 2-Per: | 3-Per: | 4-Per: | 5-Per+: |
|---|---|---|---|---|---|
| Average Annual Household Expenditure:Food | 1-Per:4,470 | 2-Per:7,802 | 3-Per:8,980 | 4-Per:11,033 | 5-Per+:11,474 |
| Average Annual Household Expenditure:Alcoholic beverages | 1-Per:383 | 2-Per:708 | 3-Per:478 | 4-Per:572 | 5-Per+:386 |
| Average Annual Household Expenditure:Housing | 1-Per:15,240 | 2-Per:21,306 | 3-Per:23,356 | 4-Per:27,226 | 5-Per+:26,434 |
| Average Annual Household Expenditure:Apparel and services | 1-Per:992 | 2-Per:1,520 | 3-Per:1,808 | 4-Per:2,716 | 5-Per+:2,580 |
| Average Annual Household Expenditure:Transportation | 1-Per:5,504 | 2-Per:10,367 | 3-Per:12,864 | 4-Per:15,049 | 5-Per+:14,325 |
| Average Annual Household Expenditure:Healthcare | 1-Per:3,273 | 2-Per:6,305 | 3-Per:5,686 | 4-Per:6,065 | 5-Per+:5,383 |
| Average Annual Household Expenditure:Entertainment | 1-Per:1,816 | 2-Per:3,475 | 3-Per:3,272 | 4-Per:4,014 | 5-Per+:3,603 |
| Average Annual Household Expenditure:Personal care products/services | 1-Per:454 | 2-Per:787 | 3-Per:765 | 4-Per:956 | 5-Per+:903 |
| Average Annual Household Expenditure:Reading | 1-Per:87 | 2-Per:128 | 3-Per:83 | 4-Per:107 | 5-Per+:93 |
| Average Annual Household Expenditure:Education | 1-Per:632 | 2-Per:1,107 | 3-Per:2,211 | 4-Per:2,337 | 5-Per+:1,882 |
| Average Annual Household Expenditure:Tobacco products/smoking products | 1-Per:230 | 2-Per:331 | 3-Per:386 | 4-Per:352 | 5-Per+:395 |
| Average Annual Household Expenditure:Miscellaneous | 1-Per:683 | 2-Per:1,018 | 3-Per:905 | 4-Per:1010 | 5-Per+:1,047 |
| Average Annual Household Expenditure:Cash contributions | 1-Per:1,576 | 2-Per:2,838 | 3-Per:1,638 | 4-Per:1,848 | 5-Per+:2,630 |
| Average Annual Household Expenditure:Personal insurance and pensions | 1-Per:3,238 | 2-Per:7,372 | 3-Per:9,514 | 4-Per:11,312 | 5-Per+:10,012 |
| Average Annual Household Expenditure:Total Average Annual Household Expenditures | 1-Per:$38,577 | 2-Per:$65,063 | 3-Per:$71,944 | 4-Per:$84,595 | 5-Per+:$81,146 |
Average U.S. Household Spending by Income
When analyzing the BLS’ data across income brackets, it’s clear that the wealthy have more fun than the lower and middle classes.
For example, Americans that earn $29,999 or less per year allocate roughly 43% of their annual budgets to housing. Conversely, Americans that earn $100,000 or more per year allocate approximately 32% of their yearly budgets to housing. Similarly, transportation costs for Americans that earn $50,000 to $69,999 per year are 18.0% of their household budgets. Conversely, transportation costs for Americans that make $200,000 or more per year are only 13.3% of their household budgets.
| Average Annual Household Expenditure: | All Incomes: | <$15,000: | $15,000-$29,999: | $30,000-$39,999: | $40,000-$49,999: |
|---|---|---|---|---|---|
| Average Annual Household Expenditure:Housing | All Incomes:21,409 | <$15,000:12,163 | $15,000-$29,999:13,483 | $30,000-$39,999:15,404 | $40,000-$49,999:16,942 |
| Average Annual Household Expenditure:Transportation | All Incomes:9,826 | <$15,000:4,388 | $15,000-$29,999:4,666 | $30,000-$39,999:6,491 | $40,000-$49,999:7,378 |
| Average Annual Household Expenditure:Food | All Incomes:7,316 | <$15,000:4,226 | $15,000-$29,999:4,087 | $30,000-$39,999:5,756 | $40,000-$49,999:5,783 |
| Average Annual Household Expenditure:Personal insurance and pensions | All Incomes:7,246 | <$15,000:454 | $15,000-$29,999:997 | $30,000-$39,999:2,130 | $40,000-$49,999:3,106 |
| Average Annual Household Expenditure:Healthcare | All Incomes:5,177 | <$15,000:2,267 | $15,000-$29,999:3,594 | $30,000-$39,999:4,180 | $40,000-$49,999:4,386 |
| Average Annual Household Expenditure:Entertainment | All Incomes:2,912 | <$15,000:1,075 | $15,000-$29,999:1,395 | $30,000-$39,999:2,101 | $40,000-$49,999:1,811 |
| Average Annual Household Expenditure:Cash contributions | All Incomes:2,283 | <$15,000:678 | $15,000-$29,999:906 | $30,000-$39,999:1,589 | $40,000-$49,999:1,232 |
| Average Annual Household Expenditure:Apparel and services | All Incomes:1,434 | <$15,000:796 | $15,000-$29,999:779 | $30,000-$39,999:851 | $40,000-$49,999:1,160 |
| Average Annual Household Expenditure:Education | All Incomes:1,271 | <$15,000:1,020 | $15,000-$29,999:283 | $30,000-$39,999:426 | $40,000-$49,999:360 |
| Average Annual Household Expenditure:Miscellaneous | All Incomes:907 | <$15,000:416 | $15,000-$29,999:500 | $30,000-$39,999:614 | $40,000-$49,999:681 |
| Average Annual Household Expenditure:Personal care products/services | All Incomes:646 | <$15,000:289 | $15,000-$29,999:345 | $30,000-$39,999:464 | $40,000-$49,999:495 |
| Average Annual Household Expenditure:Alcoholic beverages | All Incomes:478 | <$15,000:124 | $15,000-$29,999:184 | $30,000-$39,999:216 | $40,000-$49,999:320 |
| Average Annual Household Expenditure:Tobacco products/smoking products | All Incomes:315 | <$15,000:300 | $15,000-$29,999:289 | $30,000-$39,999:368 | $40,000-$49,999:353 |
| Average Annual Household Expenditure:Reading | All Incomes:114 | <$15,000:41 | $15,000-$29,999:94 | $30,000-$39,999:100 | $40,000-$49,999:74 |
| Average Annual Household Expenditure:Total Average Annual Household Expenditures | All Incomes:$61,334 | <$15,000:$28,235 | $15,000-$29,999:$31,604 | $30,000-$39,999:$40,689 | $40,000-$49,999:$44,081 |
Continuing the theme, Americans that earn $150,000 to $199,999 per year allocate 1.2% of their household budgets to alcoholic beverages. On the flip side, Americans that earn $30,000 to $39,000 per year only allocate 0.5% of their household budgets to alcoholic drinks. Likewise, Americans that make $200,000 or more per year allocate 5.3% of their household budgets to entertainment. Conversely, Americans that earn $50,000 to $69,999 per year only allocate 3.9% of their household budgets to entertainment.
| Average Annual Household Expenditure: | $50,000-$69,999: | $70,000-$99,999: | $100,000-$149,999: | $150,000-$199,999: | $200,000+: |
|---|---|---|---|---|---|
| Average Annual Household Expenditure:Housing | $50,000-$69,999:18,511 | $70,000-$99,999:21,926 | $100,000-$149,999:26,257 | $150,000-$199,999:32,804 | $200,000+:46,591 |
| Average Annual Household Expenditure:Transportation | $50,000-$69,999:9,225 | $70,000-$99,999:11,098 | $100,000-$149,999:14,888 | $150,000-$199,999:14,404 | $200,000+:19,397 |
| Average Annual Household Expenditure:Food | $50,000-$69,999:6,026 | $70,000-$99,999:7,475 | $100,000-$149,999:9,901 | $150,000-$199,999:11,002 | $200,000+:14,066 |
| Average Annual Household Expenditure:Personal insurance and pensions | $50,000-$69,999:4,625 | $70,000-$99,999:7,327 | $100,000-$149,999:11,885 | $150,000-$199,999:16,539 | $200,000+:27,429 |
| Average Annual Household Expenditure:Healthcare | $50,000-$69,999:4,958 | $70,000-$99,999:5,745 | $100,000-$149,999:6,508 | $150,000-$199,999:7,662 | $200,000+:8,997 |
| Average Annual Household Expenditure:Entertainment | $50,000-$69,999:2,004 | $70,000-$99,999:2,694 | $100,000-$149,999:4,331 | $150,000-$199,999:5,236 | $200,000+:7,654 |
| Average Annual Household Expenditure:Cash contributions | $50,000-$69,999:1,923 | $70,000-$99,999:2,695 | $100,000-$149,999:2,587 | $150,000-$199,999:3,829 | $200,000+:7,102 |
| Average Annual Household Expenditure:Apparel and services | $50,000-$69,999:1,208 | $70,000-$99,999:1,145 | $100,000-$149,999:2,037 | $150,000-$199,999:2,276 | $200,000+:3,405 |
| Average Annual Household Expenditure:Education | $50,000-$69,999:688 | $70,000-$99,999:893 | $100,000-$149,999:1,494 | $150,000-$199,999:2,426 | $200,000+:5,901 |
| Average Annual Household Expenditure:Miscellaneous | $50,000-$69,999:759 | $70,000-$99,999:1,059 | $100,000-$149,999:1,186 | $150,000-$199,999:1,656 | $200,000+:1,750 |
| Average Annual Household Expenditure:Personal care products/services | $50,000-$69,999:539 | $70,000-$99,999:652 | $100,000-$149,999:934 | $150,000-$199,999:961 | $200,000+:1,400 |
| Average Annual Household Expenditure:Alcoholic beverages | $50,000-$69,999:350 | $70,000-$99,999:444 | $100,000-$149,999:610 | $150,000-$199,999:1,228 | $200,000+:1,261 |
| Average Annual Household Expenditure:Tobacco products/smoking products | $50,000-$69,999:367 | $70,000-$99,999:351 | $100,000-$149,999:305 | $150,000-$199,999:250 | $200,000+:190 |
| Average Annual Household Expenditure:Reading | $50,000-$69,999:102 | $70,000-$99,999:90 | $100,000-$149,999:127 | $150,000-$199,999:210 | $200,000+:259 |
| Average Annual Household Expenditure:Total Average Annual Household Expenditures | $50,000-$69,999:$51,285 | $70,000-$99,999:$63,592 | $100,000-$149,999:$83,050 | $150,000-$199,999:$100,484 | $200,000+:$145,402 |
Average U.S. Household Spending by Gender
With BLS data showing that single men have APTHI of $48,994 and single women have APTHI of $35,530, the former’s annual household budget exceeds the latter.
For example, the average single male spends $40,350 per year to finance his lifestyle, while the average single female spends $37,100 to fund hers. For context, BLS data shows that single females’ average household budget exceeds their average APTHI. And according to the BLS, single women who earn $39,999 or less per year spend more money on household expenses than they make in pre-tax income. Conversely, only single men with APTHI of $29,999 per year or less spend more than they earn.
Interestingly, though, spending habits differ materially across genders. For example, single men spend 2.04x and 2.02x single women on tobacco products and alcoholic beverages, respectively. Likewise, they also allocate 1.58x to their pensions and insurance products.
Conversely, single men only spend 41%, 65%, and 77% of what single women spend on personal care, reading materials, and healthcare. Likewise, single men only spend 83% of what single women spend on clothing and apparel.
| Average Annual Household Expenditure: | Single Men: | Single Women: |
|---|---|---|
| Average Annual Household Expenditure:Housing | Single Men:15,216 | Single Women:15,253 |
| Average Annual Household Expenditure:Transportation | Single Men:6,372 | Single Women:4,781 |
| Average Annual Household Expenditure:Food | Single Men:4,744 | Single Women:4,250 |
| Average Annual Household Expenditure:Personal insurance and pensions | Single Men:4,047 | Single Women:2,564 |
| Average Annual Household Expenditure:Healthcare | Single Men:2,823 | Single Women:3,648 |
| Average Annual Household Expenditure:Entertainment | Single Men:2,106 | Single Women:1,577 |
| Average Annual Household Expenditure:Cash contributions | Single Men:1,701 | Single Women:1,471 |
| Average Annual Household Expenditure:Apparel and services | Single Men:889 | Single Women:1,072 |
| Average Annual Household Expenditure:Miscellaneous | Single Men:684 | Single Women:683 |
| Average Annual Household Expenditure:Education | Single Men:600 | Single Women:659 |
| Average Annual Household Expenditure:Alcoholic beverages | Single Men:531 | Single Women:263 |
| Average Annual Household Expenditure:Tobacco products/smoking products | Single Men:318 | Single Women:156 |
| Average Annual Household Expenditure:Personal care products/services | Single Men:252 | Single Women:618 |
| Average Annual Household Expenditure:Reading | Single Men:67 | Single Women:103 |
| Average Annual Household Expenditure:Total Average Annual Household Expenditures | Single Men:$40,350 | Single Women:$37,100 |
Average U.S. Household Spending by Race
The BLS organizes the data by percentages from a racial perspective and outlines what proportion each race and category contributes to the consolidated average.
For context, White Americans are grouped with ‘all other races,’ while Hispanic, Asian and Black Americans are categorized individually. Moreover, when interpreting the data, it’s best to analyze the results relative to each race’s proportion of the U.S. population.
For example, the U.S. Census Bureau released its 2020 Census on Aug. 12. And the data shows that Black Americans made up 12.4% of the U.S. population in 2020. However, Black Americans only exceeded 12.4% of the consolidated average household expenditures in apparel and services at 12.5%. Moreover, their share of consolidated household spending is below their population average in all other groupings.
For context, the BLS data shows that Black Americans 16 years or older earned $799 in median weekly earnings in the third quarter of 2021 — the second-lowest among all ethnic groups and 20% below the racial average. As a result, lower household incomes help explain the lower share of consolidated household expenses.
Similarly, Hispanic Americans made up 18.7% of the U.S. population in 2020. However, the BLS data shows that Hispanic Americans 16 years or older earned $779 in median weekly earnings in the third quarter of 2021 — the lowest among all ethnic groups and 22% below the racial average. In addition, and unsurprisingly, their share of consolidated spending in all categories is below their population average.
Interestingly, Asian Americans made up 6% of the U.S. population in 2020. And the BLS data shows that Asian Americans 16 years or older earned $1,309 in median weekly earnings in the third quarter of 2021 — the highest among all ethnic groups and 31% above the racial average.
Moreover, Asian Americans exhibit prudent spending habits. For example, Asian Americans account for 10.8% of consolidated household spending on education — well above their population average. Similarly, the only other categories that exceed Asian Americans’ population are spending on food (6.2%) and pensions/insurance (6.5%).
| Household Expenditures: | Hispanic: | Asian: | Black: | White + All Other Races: |
|---|---|---|---|---|
| Household Expenditures:Food | Hispanic:13.2% | Asian:6.2% | Black:10.4% | White + All Other Races:70.2% |
| Household Expenditures:Alcoholic beverages | Hispanic:7.3% | Asian:3.6% | Black:6.1% | White + All Other Races:83.0% |
| Household Expenditures:Housing | Hispanic:13.0% | Asian:5.6% | Black:11.2% | White + All Other Races:70.2% |
| Household Expenditures:Apparel and services | Hispanic:15.7% | Asian:5.0% | Black:12.5% | White + All Other Races:66.8% |
| Household Expenditures:Transportation | Hispanic:14.7% | Asian:4.0% | Black:10.8% | White + All Other Races:70.5% |
| Household Expenditures:Healthcare | Hispanic:9.0% | Asian:4.5% | Black:9.0% | White + All Other Races:77.5% |
| Household Expenditures:Entertainment | Hispanic:8.4% | Asian:3.3% | Black:6.7% | White + All Other Races:81.6% |
| Household Expenditures:Personal care products/services | Hispanic:12.7% | Asian:5.6% | Black:11.3% | White + All Other Races:70.4% |
| Household Expenditures:Reading | Hispanic:7.3% | Asian:4.4% | Black:8.0% | White + All Other Races:80.3% |
| Household Expenditures:Education | Hispanic:6.0% | Asian:10.8% | Black:8.1% | White + All Other Races:75.1% |
| Household Expenditures:Tobacco products/smoking products | Hispanic:7.7% | Asian:2.7% | Black:9.9% | White + All Other Races:79.7% |
| Household Expenditures:Miscellaneous | Hispanic:11.4% | Asian:4.6% | Black:9.5% | White + All Other Races:74.5% |
| Household Expenditures:Cash contributions | Hispanic:6.3% | Asian:2.7% | Black:6.9% | White + All Other Races:84.1% |
| Household Expenditures:Personal insurance and pensions | Hispanic:11.3% | Asian:6.5% | Black:9.5% | White + All Other Races:72.7% |
How We Conducted The Study
ElitePersonalFinance always has up-to-date studies.
Our goal is to consolidate the information and present the findings in a way that’s easy to understand by parsing through the latest data from reliable sources. If you enjoyed the study, please provide your feedback. Moreover, if there is anything that we missed or anything that you believe needs updating, please let us know, and we will respond promptly.
Conclusion
With COVID-19 forcing many Americans to shift their household expenditures from leisure and entertainment to the at-home experience, spending on categories that typically exhibit growth were underperformers in 2020. However, with the threat of the virus receding, these laggards will likely become leaders when the BLS releases its mid-year update in 2022. Conversely, with inflation still surging, Americans’ finances may suffer unless the pricing pressures abate. As a result, 2022 should be even more interesting than 2021.