Average Credit Score in America of August 2026

The average credit score in America is 716.
\It’s another year and another record-high for the average U.S. FICO Score. And after the five-point increase in 2021, the latest rise is a function of many factors, and the pandemic did little to deter the credit boom that unfolded across the United States.
But before that a few words about our studies.
Why Should You Trust ElitePersonalFinance?
With accuracy and accountability in mind, we pride ourselves on presenting you with the latest information from the most reliable sources. We carefully select data from the largest credit reporting agencies – like FICO, Equifax, Experian, and TransUnion. In addition, we augment our studies with relevant data from the U.S. government, the U.S. Federal Reserve (Fed), the Consumer Financial Protection Bureau (CFPB), and other reputable research institutions.
Moreover, our editorial team carefully vets all of the findings, and sources are present at the bottom of the page.

Average Credit Score in America of August 2026: Statistics and Key Findings

The average U.S. FICO Score is 716 – a new all-time high and five points higher than 2020.
The average U.S. FICO Score has demonstrated a clear uptrend since 2009 and has increased by 30 points during that timeframe.
In 2021, nearly 63% of Americans had a FICO Score of more than 699.
FICO considers 716 a “good” credit score.
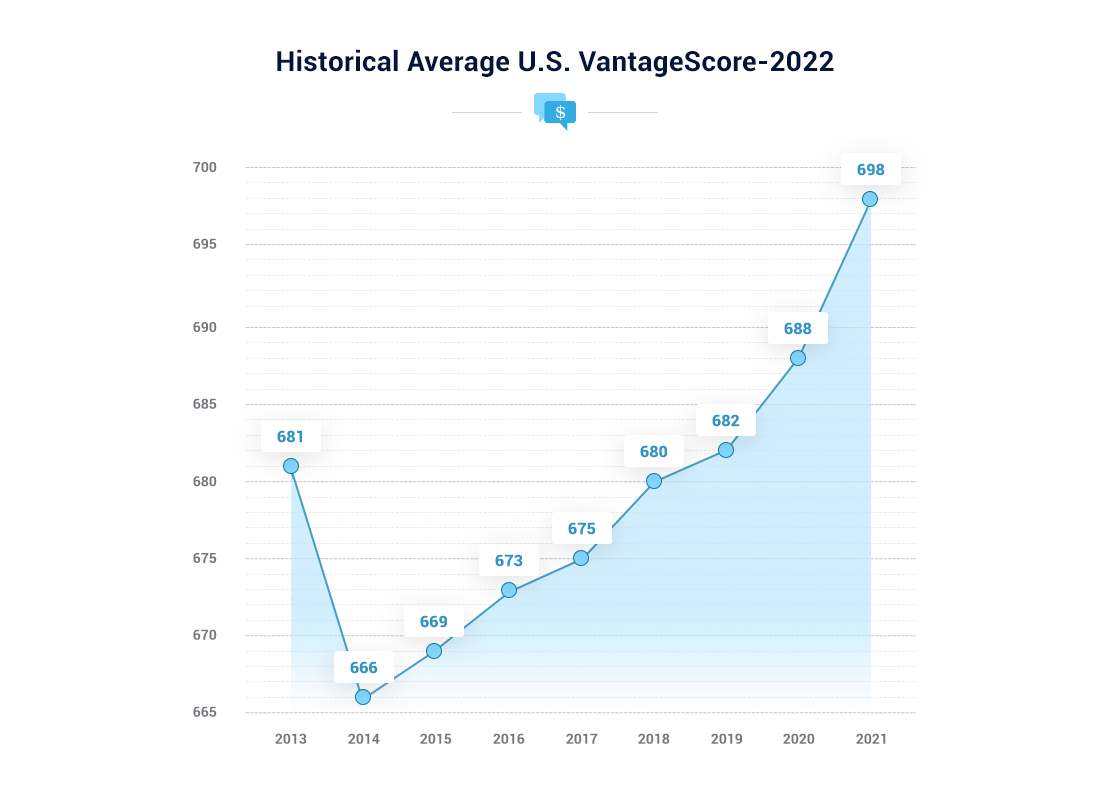
The average U.S. VantageScore is 698 – a new all-time high and 10 points higher than 2020.
By State:
Minnesota (724), Vermont (721), and Massachusetts (720) are the U.S. states with the highest average VantageScore.
Mississippi (662), Louisiana (669), and Alabama (671) are the U.S. states with the lowest average VantageScore.
Alabama, Kentucky, and Mississippi are the U.S. states with the highest bankruptcy rates per capita.
By Age:
There is a positive correlation between Americans’ age and credit scores: the older they are, the higher their credit scores.
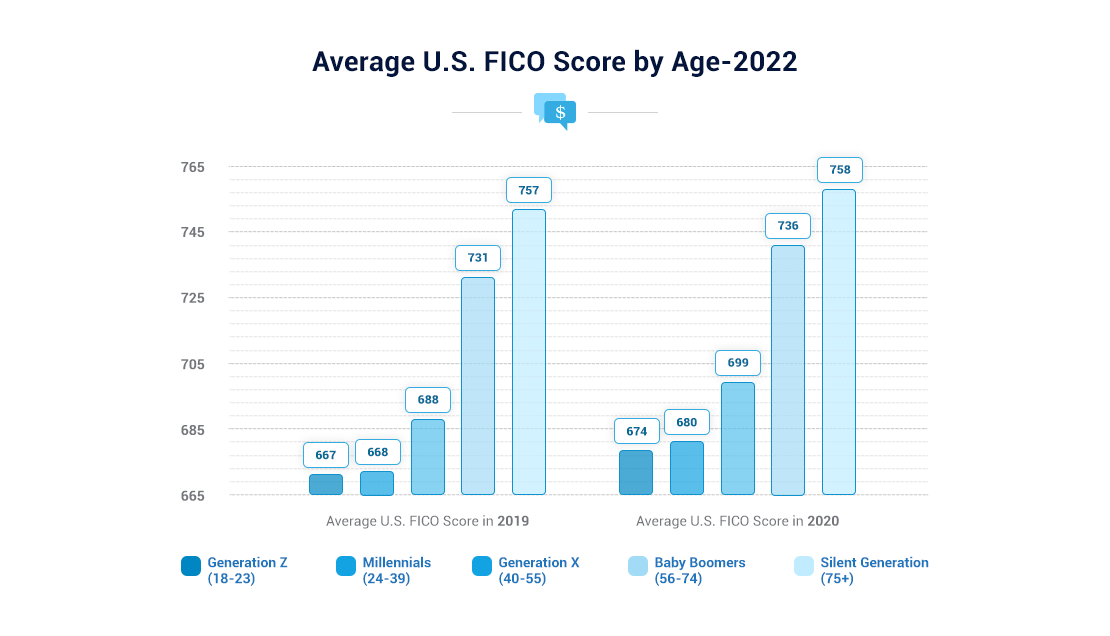
The Silent Generation (75+) has an average U.S. FICO Score of 758 – 47 points higher than the national average.
Generation Z (18-23) has an average U.S. FICO Score of 674 – 37 points less than the national average.
Americans aged 18-29 have the highest proportion of their total loans in serious delinquency (90+ days past due) as of Q3 2021.
Americans aged 18-29 have the highest proportion of their credit card loans in serious delinquency (90+ days past due) as of Q3 2021.
By Income:
There is a positive correlation between Americans’ incomes and credit scores: the higher their incomes, the higher their credit scores.
High-income Americans have a median Equifax Risk Score of 774, while low-income Americans have a median Equifax Risk Score of 658.
By Race:
Asian Americans (745) have the highest average credit score, while Black Americans (677) have the lowest.
By Gender:
American men have an average VantageScore of 781, while American women have an average VantageScore of 774.
Data from the U.S. Department of Labor (DOL) shows that women earn 82% of men’s median salary. And with credit scores highly correlated with incomes, the dynamic places women at a disadvantage.
By Credit Bracket:
15.5% (39.28 million) of Americans have bad credit, 21.7% (54.99 million) have fair credit, and 62.8% (159.15 million) have good credit.
The percentage of Americans with good credit increased by 5% year-over-year (YoY) – the highest YoY percentage increase in sixteen years.
Alternative Data:
TransUnion found that disclosing rent payment history increased Americans’ VantageScore by an average of nearly 60 points (data compiled through March 2021).
Roughly 9% of Americans with no credit score that disclosed their rent payment history saw their VantageScore debut at an average of 631.
12% of Americans with established credit scores saw their credit scores increase after disclosing their rent payments.
60% of participants may receive an immediate uplift in their credit scores during the same month that their rent disclosures begin.
The Pandemic Effect:
TransUnion found that 58% of Americans that enrolled in financial hardship programs during the pandemic increased their VantageScore.
Americans that exited hardship programs early demonstrated a 4.8% delinquency rate (30+ days past due) in the six months after obtaining a new bank card in the fourth quarter of 2020.
Americans that remained in hardships programs demonstrated a 4.9% delinquency rate during that same timeframe.
Americans that avoided hardship programs showed a 5.1% delinquency rate during that same timeframe.
Average Credit Score in America of August 2026: Charts, Graph, Analysis

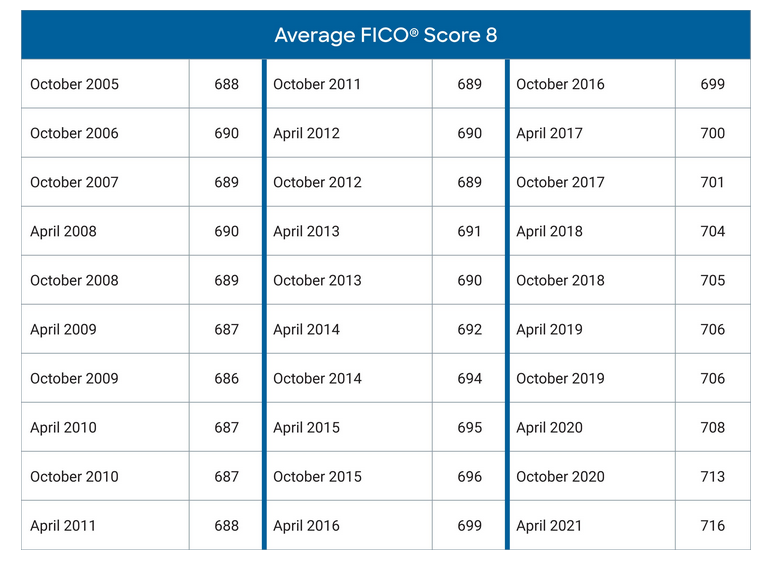
Historical Average U.S. FICO Score
While America’s on-again, off-again relationship with COVID-19 has sent consumer confidence on a wild ride, U.S. credit scores have been significant beneficiaries. Moreover, Americans’ balance sheets have never been more resilient, with enhanced unemployment benefits, surging stock prices, and record-breaking home prices uplifting U.S. household wealth.
Thanks to the CARES Act and private lenders providing loan forbearance programs, U.S. delinquency rates, and personal bankruptcies have also fallen to record lows. As a result, the average U.S. FICO Score hit a new all-time high of 716 in 2021 and recorded its ninth-straight annual increase.
| Year: | Average U.S. FICO Score: |
|---|---|
| Year:2005 | Average U.S. FICO Score:688 |
| Year:2006 | Average U.S. FICO Score:690 |
| Year:2007 | Average U.S. FICO Score:689 |
| Year:2008 | Average U.S. FICO Score:689 |
| Year:2009 | Average U.S. FICO Score:686 |
| Year:2010 | Average U.S. FICO Score:687 |
| Year:2011 | Average U.S. FICO Score:689 |
| Year:2012 | Average U.S. FICO Score:689 |
| Year:2013 | Average U.S. FICO Score:690 |
| Year:2014 | Average U.S. FICO Score:694 |
| Year:2015 | Average U.S. FICO Score:696 |
| Year:2016 | Average U.S. FICO Score:699 |
| Year:2017 | Average U.S. FICO Score:701 |
| Year:2018 | Average U.S. FICO Score:705 |
| Year:2019 | Average U.S. FICO Score:706 |
| Year:2020 | Average U.S. FICO Score:711 |
| Year:2021 | Average U.S. FICO Score:716 |
ElitePersonalFinance analysis of FDIC data.
Historical Average U.S. VantageScore
Recording the highest point increase in eight years, the average U.S. VantageScore increased by 10 points from 2020 to 2021. And consistent with the data released by FICO, the CARES Act, and record-high asset prices combined to create nirvana for U.S. creditworthiness.
| Year: | Average U.S. VantageScore: |
|---|---|
| Year:2013 | Average U.S. VantageScore:681 |
| Year:2014 | Average U.S. VantageScore:666 |
| Year:2015 | Average U.S. VantageScore:669 |
| Year:2016 | Average U.S. VantageScore:673 |
| Year:2017 | Average U.S. VantageScore:675 |
| Year:2018 | Average U.S. VantageScore:680 |
| Year:2019 | Average U.S. VantageScore:682 |
| Year:2020 | Average U.S. VantageScore:688 |
| Year:2021 | Average U.S. VantageScore:698 |
Average U.S. VantageScore by State
With the latest data from Equifax revealing that Minnesota remains the gold standard for U.S. creditworthiness, the mid-western state has an average VantageScore of 724. Earning the silver and bronze medals, Vermont is second at 721, while Massachusetts is third at 720.
On the flip side, Mississippi is the worst performer, with an average VantageScore of 662. Likewise, Louisiana and Alabama have the second and third-worst-performing scores of 669 and 671, respectively. For context, the average U.S. VantageScore is 698.
| State: | Average U.S. VantageScore: |
|---|---|
| State:Alaska | Average U.S. VantageScore:697 |
| State:Alabama | Average U.S. VantageScore:671 |
| State:Arkansas | Average U.S. VantageScore:677 |
| State:Arizona | Average U.S. VantageScore:698 |
| State:California | Average U.S. VantageScore:709 |
| State:Colorado | Average U.S. VantageScore:714 |
| State:Connecticut | Average U.S. VantageScore:710 |
| State:District of Columbia | Average U.S. VantageScore:699 |
| State:Delaware | Average U.S. VantageScore:696 |
| State:Florida | Average U.S. VantageScore:689 |
| State:Georgia | Average U.S. VantageScore:674 |
| State:Guam | Average U.S. VantageScore:681 |
| State:Hawaii | Average U.S. VantageScore:716 |
| State:Iowa | Average U.S. VantageScore:711 |
| State:Idaho | Average U.S. VantageScore:706 |
| State:Illinois | Average U.S. VantageScore:704 |
| State:Indiana | Average U.S. VantageScore:693 |
| State:Kansas | Average U.S. VantageScore:701 |
| State:Kentucky | Average U.S. VantageScore:680 |
| State:Louisiana | Average U.S. VantageScore:669 |
| State:Massachusetts | Average U.S. VantageScore:720 |
| State:Maryland | Average U.S. VantageScore:698 |
| State:Maine | Average U.S. VantageScore:708 |
| State:Michigan | Average U.S. VantageScore:705 |
| State:Minnesota | Average U.S. VantageScore:724 |
| State:Missouri | Average U.S. VantageScore:692 |
| State:Mississippi | Average U.S. VantageScore:662 |
| State:Montana | Average U.S. VantageScore:708 |
| State:North Carolina | Average U.S. VantageScore:684 |
| State:North Dakota | Average U.S. VantageScore:715 |
| State:Nebraska | Average U.S. VantageScore:715 |
| State:New Hampshire | Average U.S. VantageScore:718 |
| State:New Jersey | Average U.S. VantageScore:710 |
| State:New Mexico | Average U.S. VantageScore:683 |
| State:Nevada | Average U.S. VantageScore:681 |
| State:New York | Average U.S. VantageScore:712 |
| State:Ohio | Average U.S. VantageScore:695 |
| State:Oklahoma | Average U.S. VantageScore:675 |
| State:Oregon | Average U.S. VantageScore:713 |
| State:Pennsylvania | Average U.S. VantageScore:708 |
| State:Puerto Rico | Average U.S. VantageScore:689 |
| State:Rhode Island | Average U.S. VantageScore:709 |
| State:South Carolina | Average U.S. VantageScore:675 |
| State:South Dakota | Average U.S. VantageScore:717 |
| State:Tennessee | Average U.S. VantageScore:682 |
| State:Texas | Average U.S. VantageScore:674 |
| State:Utah | Average U.S. VantageScore:708 |
| State:Virginia | Average U.S. VantageScore:700 |
| State:Virgin Islands | Average U.S. VantageScore:676 |
| State:Vermont | Average U.S. VantageScore:721 |
| State:Washington | Average U.S. VantageScore:715 |
| State:Wisconsin | Average U.S. VantageScore:717 |
| State:West Virginia | Average U.S. VantageScore:679 |
Wyoming wasn’t provided by Equifax.
Interestingly, the New York Fed’s latest Household Debt and Credit Report shows that California, New Jersey, and Arizona have the highest debt levels per capita in the U.S. However, California (709) and New Jersey (710) both have average VantageScores that exceed the U.S. average, while Arizona (698) sits right on the national average. And regarding the latter, Arizona residents suffered the most foreclosures per capita in the third quarter of 2021.
Conversely, Nevada residents had the highest percentage of their borrowers file for bankruptcy in Q3, and Nevada (681) has an average VantageScore that’s 17 points below the national average.
Also noteworthy, Experian analyzed data from when states began reporting their credit history up until August 2021. And with Alabama sporting a bankruptcy rate of 0.14, there are, on average, 14 bankruptcies per 100 people in the state. As a result, it’s no surprise that Alabama has the third-lowest average VantageScore in the U.S.
Coincidently, Louisiana – which has the second-lowest average VantageScore in the U.S. – didn’t make Experian’s top 10 list. Despite that, the majority of the names are concentrated in southern states that have the lowest average VantageScores.
| State: | Average Total Debt Per Capita: | Average # of Bankruptcy Filings Per Capita: | Average U.S. FICO Score: |
|---|---|---|---|
| State:Alabama | Average Total Debt Per Capita:$72,062 | Average # of Bankruptcy Filings Per Capita:0.14 | Average U.S. FICO Score:691 |
| State:Kentucky | Average Total Debt Per Capita:$68,624 | Average # of Bankruptcy Filings Per Capita:0.11 | Average U.S. FICO Score:702 |
| State:Mississippi | Average Total Debt Per Capita:$60,375 | Average # of Bankruptcy Filings Per Capita:0.11 | Average U.S. FICO Score:681 |
| State:Nevada | Average Total Debt Per Capita:$105,113 | Average # of Bankruptcy Filings Per Capita:0.11 | Average U.S. FICO Score:701 |
| State:Tennessee | Average Total Debt Per Capita:$83,508 | Average # of Bankruptcy Filings Per Capita:0.11 | Average U.S. FICO Score:701 |
| State:Ohio | Average Total Debt Per Capita:$70,488 | Average # of Bankruptcy Filings Per Capita:0.10 | Average U.S. FICO Score:715 |
| State:Illinois | Average Total Debt Per Capita:$85,146 | Average # of Bankruptcy Filings Per Capita:0.10 | Average U.S. FICO Score:720 |
| State:Georgia | Average Total Debt Per Capita:$86,964 | Average # of Bankruptcy Filings Per Capita:0.10 | Average U.S. FICO Score:693 |
| State:Arkansas | Average Total Debt Per Capita:$69,309 | Average # of Bankruptcy Filings Per Capita:0.10 | Average U.S. FICO Score:694 |
| State:Indiana | Average Total Debt Per Capita:$73,817 | Average # of Bankruptcy Filings Per Capita:0.10 | Average U.S. FICO Score:712 |
Average U.S. FICO Score by Age
Like a fine wine, Americans’ credit scores improve with age. And with older generations grabbing the baton from younger generations, the data highlights how a strong credit profile is built over a lifetime.
To that point, The Silent Generation’s average U.S. FICO Score is 758 – 47 points higher than the national average. Conversely, Generation Z’s average U.S. FICO Score is 674 – 37 points less than the national average.
| Generation: | 2019: | 2020: |
|---|---|---|
| Generation:Generation Z (18-23) | 2019:667 | 2020:674 |
| Generation:Millennials (24-39) | 2019:668 | 2020:680 |
| Generation:Generation X (40-55) | 2019:688 | 2020:699 |
| Generation:Baby Boomers (56-74) | 2019:731 | 2020:736 |
| Generation:Silent Generation (75+) | 2019:757 | 2020:758 |
And what drives the divergence?
Well, simple accounting often solves the trick. For example, with older Americans often owning their homes and having built up reliable savings, their assets greatly outweigh their liabilities. Likewise, they usually have reliable pension income that supports their monthly expenditures. As a result, their creditworthiness is much higher.
On the flip side, younger Americans often have fewer assets, more liabilities and haven’t fully established their working careers. As a result, they’re deemed ‘higher risk’ due to their lack of liquid assets and potential collateral.
As evidence, the New York Fed’s Household Debt and Credit Report found that Americans aged 18-29 have the highest proportion of their total loans in serious delinquency (90+ days past due) as of Q3 2021. Moreover, Americans aged 30-39 were second on the list. Isolating auto loans, the 18-29 cohort has the highest serious delinquency rate at nearly 3%, while the 30-39 cohort is not far behind at roughly 2%. Conversely, all other age groups sit below approximately 1.5%.
Likewise, roughly 5% of the 18-29 cohort’s credit card balances are in serious delinquency, while all other age groups are nearly 4% or less. Thus, the ominous data supports why younger generations often have lower credit scores.
Median U.S. Equifax Risk Score by Income
The New York Fed found that median credit scores are highly correlated with income. And with Americans in lower-income brackets often having less access to affordable credit, they often fall behind on their payments, which reduces their credit scores. As such, the vicious circle often keeps these Americans from achieving their financial goals.
For context, the income brackets define as follows:
- Low income: < 50% of an area’s median income.
- Moderate income: 50%-79% of an area’s median income.
- Medium income: 80%-120% of an area’s median income.
- High income: > 120% of an area’s median income.
| Income Bracket: | Median U.S. Equifax Risk Score: |
|---|---|
| Income Bracket:Low Income | Median U.S. Equifax Risk Score:658 |
| Income Bracket:Moderate Income | Median U.S. Equifax Risk Score:692 |
| Income Bracket:Middle Income | Median U.S. Equifax Risk Score:735 |
| Income Bracket:High Income | Median U.S. Equifax Risk Score:774 |
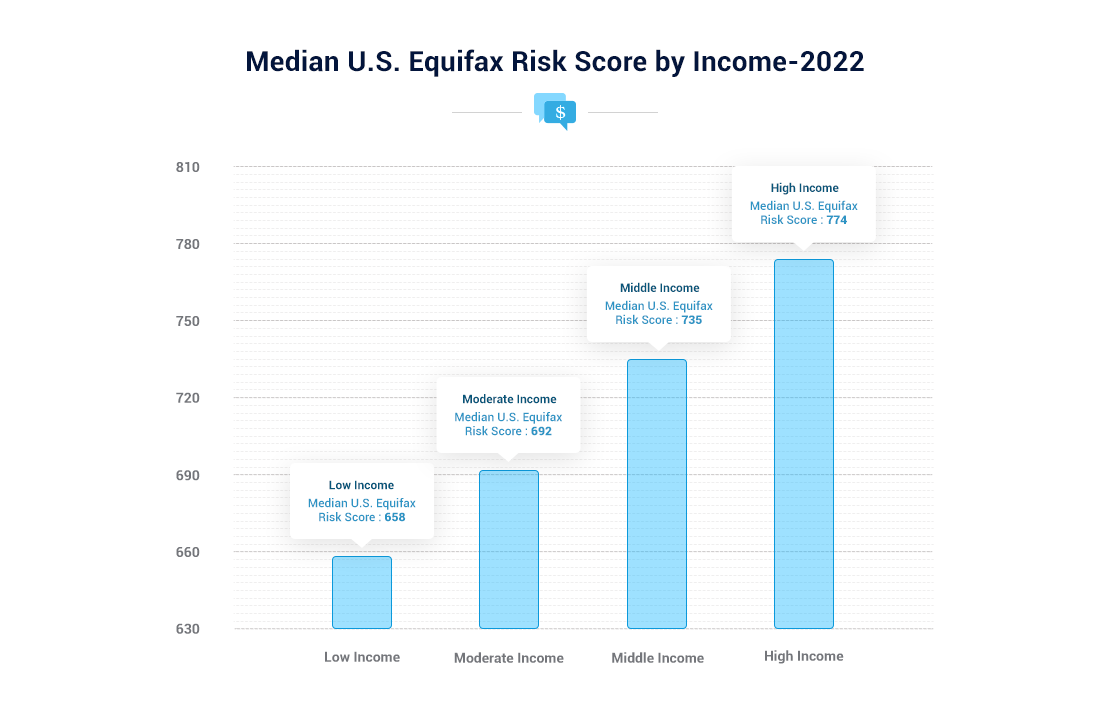
Also noteworthy, Equifax Risk Scores are nearly interchangeable with FICO Scores. However, the data from Equifax is for educational purposes, and lenders don’t use it to determine your creditworthiness. However, the overall assessment is the same: the higher the credit score, the lower the credit risk.
Average U.S. Credit Score by Race
In a study conducted by the U.S. Fed, researchers found that Asian Americans (745) have the highest average credit score, while Black Americans (677) have the lowest average credit score. Moreover, Credit Sesame surveyed 5,000 U.S. adults and found that 54% of Black respondents had poor or fair credit (meaning a score of less than 640). Conversely, only 37% of White Americans and 18% of Asian Americans suffer from the same affliction.
On top of that, 53% of Black respondents claim that they live paycheck-to-paycheck – which is higher than the overall average of 44% – and only 53% of respondents claim to have a credit card. In contrast, 67% of White Americans and 79% of Asian Americans reported having one credit card or more.
| Race: | Average U.S. Credit Score: |
|---|---|
| Race:Asians | Average U.S. Credit Score:745 |
| Race:Blacks | Average U.S. Credit Score:677 |
| Race:Hispanic White | Average U.S. Credit Score:701 |
| Race:Non-Hispanic White | Average U.S. Credit Score:734 |
| Race:All Other | Average U.S. Credit Score:732 |
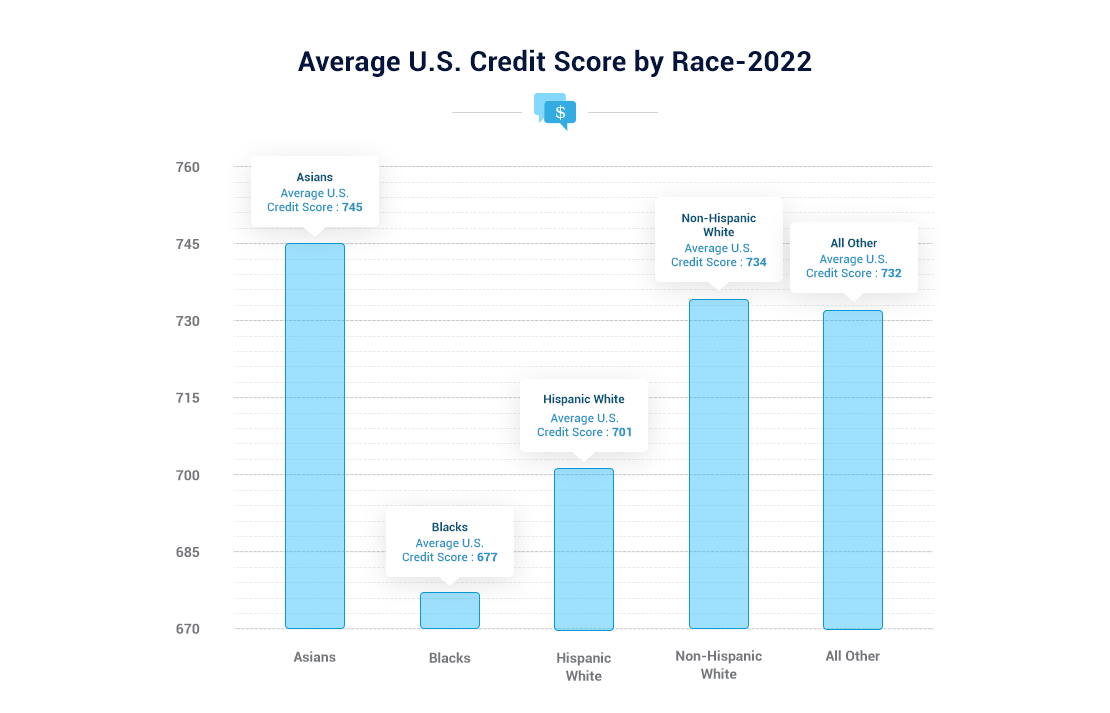
For context, healthy credit history is vital to increasing your credit score. And with Black Americans less likely to obtain a credit card, they often start their journey from a disadvantaged position.
For example, the Consumer Financial Protection Bureau (CFPB) found that Black and Hispanic Americans are more likely to have errors and disputes on their credit profiles than other races. And whether it’s auto loans, student loans, credit cards, or retail cards, jurisdictions with mostly White residents had less than half the number of disputes on their credit reports than jurisdictions with mostly Black residents.
Moreover, when isolating auto loans, the CFPB found that citizens in Black neighborhoods had more than three times more disputes on their credit profiles when compared to similar White areas. As a result, the CFPB said it would continue to investigate the root causes of the demographic disparities.
Average U.S. VantageScore by Gender
As mentioned above, your income is highly correlated with your credit score. And with the U.S. Department of Labor (DOL) revealing that women earn roughly 82% of men’s median salary, the income gap helps explain the relative underperformance of women’s credit scores.
However, the Pew Research Center found that women aged 25-34 earn roughly 93% of their male counterparts’ income. In 1980, that figure was 67%. Despite that, though, the nonpartisan think tank estimates that women have to work 42 more days per year to match men’s earnings.
Also noteworthy, while educational differentials have narrowed in recent years, Pew researchers found that women hold more lower-paying jobs than men. Thus, the outcome is lower average and median VantageScores.
| Age: | Male: | Female: |
|---|---|---|
| Age:21-30 | Male:768 | Female:762 |
| Age:31-40 | Male:793 | Female:785 |
| Age:Overall Average | Male:781 | Female:774 |
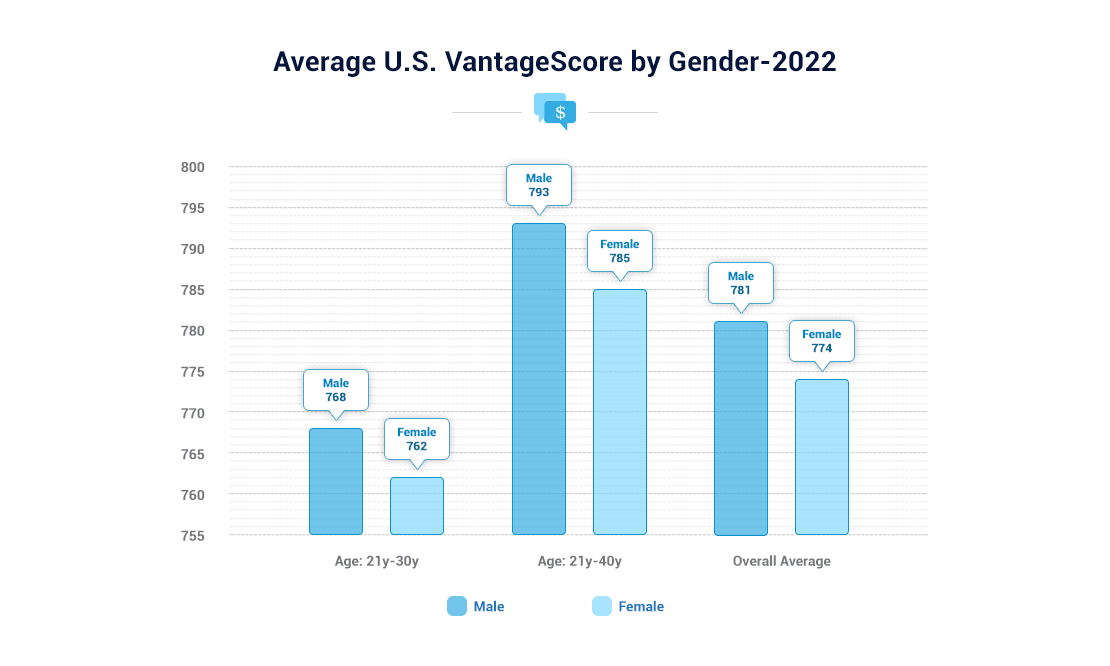
In addition, the U.S. Fed found that women often have higher debt usage, longer credit histories, higher debt outstanding, increased use of credit revolvers, and higher installment loan balances than men. Moreover, delinquency rates are higher in women than men. However, males often exhibit higher rates of bankruptcy.
U.S. Citizens With Bad, Fair, and Good Credit
With FICO breaking down its data by population, the analytics company provides a snapshot of the percent of the U.S. population that falls within specific FICO Score brackets. As a result, it allowed us to parse the data and determine the percent of the U.S. population with bad, fair, and good credit.
For context, our results assume the following guidelines:
- We define bad credit as a FICO Score that’s less than 600
- We define fair credit as a FICO Score that’s between 600 and 699
- We define good credit as a FICO Score that’s greater than 699
Interestingly enough, the percentage of the U.S. population with bad credit has declined since 2010. But, conversely, the U.S. population has risen steadily since 2011. And with pandemic assistance increasing U.S. household wealth, the former hit an all-time low in 2021, while the latter hit an all-time high. As a result, Americans have never been more creditworthy in the eyes of FICO.
| Year: | Bad Credit (< 600): | Fair Credit (600-699): | Good Credit (> 699): |
|---|---|---|---|
| Year:2005 | Bad Credit:23.6% | Fair Credit:23.1% | Good Credit:53.3% |
| Year:2006 | Bad Credit:23.1% | Fair Credit:23.0% | Good Credit:53.9% |
| Year:2007 | Bad Credit:29.4% | Fair Credit:22.6% | Good Credit:48.0% |
| Year:2008 | Bad Credit:24.1% | Fair Credit:21.6% | Good Credit:54.3% |
| Year:2009 | Bad Credit:25.1% | Fair Credit:21.5% | Good Credit:53.4% |
| Year:2010 | Bad Credit:25.5% | Fair Credit:21.4% | Good Credit:53.1% |
| Year:2011 | Bad Credit:24.9% | Fair Credit:21.9% | Good Credit:53.2% |
| Year:2012 | Bad Credit:24.2% | Fair Credit:22.3% | Good Credit:53.5% |
| Year:2013 | Bad Credit:23.9% | Fair Credit:22.3% | Good Credit:53.8% |
| Year:2014 | Bad Credit:23.1% | Fair Credit:23.0% | Good Credit:53.9% |
| Year:2015 | Bad Credit:21.9% | Fair Credit:23.3% | Good Credit:54.8% |
| Year:2016 | Bad Credit:20.7% | Fair Credit:23.6% | Good Credit:55.7% |
| Year:2017 | Bad Credit:20.0% | Fair Credit:23.2% | Good Credit:56.8% |
| Year:2018 | Bad Credit:19.1% | Fair Credit:22.6% | Good Credit:58.3% |
| Year:2019 | Bad Credit:18.9% | Fair Credit:21.8% | Good Credit:59.3% |
| Year:2020 | Bad Credit:18.6% | Fair Credit:21.3% | Good Credit:60.1% |
| Year:2021 | Bad Credit:15.5% | Fair Credit:21.7% | Good Credit:62.8% |
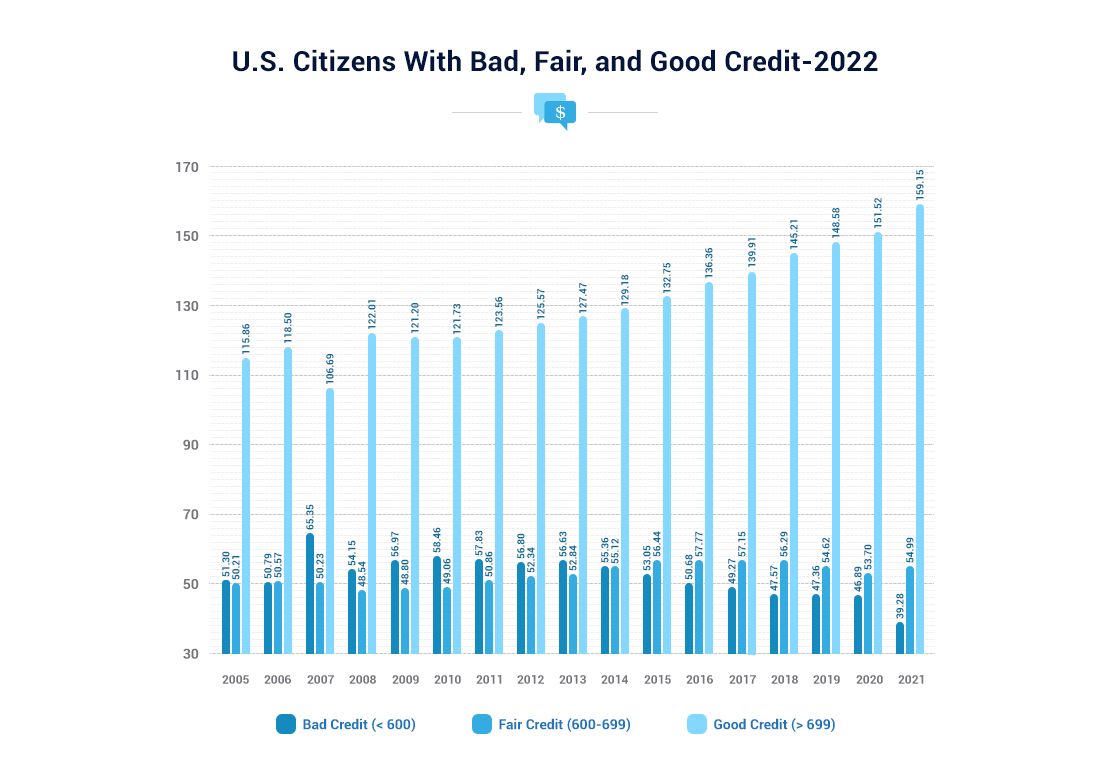
Furthermore, with the U.S. population rising alongside the number of Americans with good credit, the milestone increased at its fastest pace in sixteen years. To explain, Americans that are 18 years of age or older have credit scores. As a result, we gathered data from the U.S. Census Bureau to determine the number of U.S. citizens that were 18 or older in each year.
For context, the figures below are presented in millions (except for the percentage changes). And if you analyze the rise in 2021, you can see that the YoY growth in the number of Americans with good credit is tracking well ahead of its historical average.
| Year: | Bad Credit (< 600): | Fair Credit (600-699): | Good Credit (> 699): | Change in Americans With Good Credit: |
|---|---|---|---|---|
| Year:2005 | Bad Credit:51.30 | Fair Credit:50.21 | Good Credit:115.86 | Change in Americans With Good Credit: |
| Year:2006 | Bad Credit:50.79 | Fair Credit:50.57 | Good Credit:118.50 | Change in Americans With Good Credit:2.3% |
| Year:2007 | Bad Credit:65.35 | Fair Credit:50.23 | Good Credit:106.69 | Change in Americans With Good Credit:-10.0% |
| Year:2008 | Bad Credit:54.15 | Fair Credit:48.54 | Good Credit:122.01 | Change in Americans With Good Credit:14.4% |
| Year:2009 | Bad Credit:56.97 | Fair Credit:48.80 | Good Credit:121.20 | Change in Americans With Good Credit:-0.7% |
| Year:2010 | Bad Credit:58.46 | Fair Credit:49.06 | Good Credit:121.73 | Change in Americans With Good Credit:0.4% |
| Year:2011 | Bad Credit:57.83 | Fair Credit:50.86 | Good Credit:123.56 | Change in Americans With Good Credit:1.5% |
| Year:2012 | Bad Credit:56.80 | Fair Credit:52.34 | Good Credit:125.57 | Change in Americans With Good Credit:1.6% |
| Year:2013 | Bad Credit:56.63 | Fair Credit:52.84 | Good Credit:127.47 | Change in Americans With Good Credit:1.5% |
| Year:2014 | Bad Credit:55.36 | Fair Credit:55.12 | Good Credit:129.18 | Change in Americans With Good Credit:1.3% |
| Year:2015 | Bad Credit:53.05 | Fair Credit:56.44 | Good Credit:132.75 | Change in Americans With Good Credit:2.8% |
| Year:2016 | Bad Credit:50.68 | Fair Credit:57.77 | Good Credit:136.36 | Change in Americans With Good Credit:2.7% |
| Year:2017 | Bad Credit:49.27 | Fair Credit:57.15 | Good Credit:139.91 | Change in Americans With Good Credit:2.6% |
| Year:2018 | Bad Credit:47.57 | Fair Credit:56.29 | Good Credit:145.21 | Change in Americans With Good Credit:3.8% |
| Year:2019 | Bad Credit:47.36 | Fair Credit:54.62 | Good Credit:148.58 | Change in Americans With Good Credit:2.3% |
| Year:2020 | Bad Credit:46.89 | Fair Credit:53.70 | Good Credit:151.52 | Change in Americans With Good Credit:2.0% |
| Year:2021 | Bad Credit:39.28 | Fair Credit:54.99 | Good Credit:159.15 | Change in Americans With Good Credit:5.0% |
Alternative Data and Your Credit Score
While your payment history and credit utilization accounts for 35% and 30% of your FICO Score calculation, TransUnion found that Americans that disclose their rent payments boost their VantageScore by an average of nearly 60 points (data compiled through March 2021). Moreover, borrowers with the lowest credit scores, no credit score, or those considered subprime were the primary beneficiaries when rent payments were included in their credit profiles.
For example, after disclosing their rent payment history, roughly 9% of Americans with no credit score saw their VantageScore debut at an average of 631– which places them in the ‘fair’ credit bracket. Likewise, 12% of Americans with established credit scores saw an increase in their credit scores after disclosing their rent payments.
On top of that, TransUnion revealed that 60% of participants might receive an immediate uplift in their credit scores in the same month as their rent payment disclosures. As a result, alternative data is a unique way to increase your perceived creditworthiness.
The Pandemic, Forbearance, and the Average U.S. Credit Score
With the CARES Act and private U.S. lenders offering loan forbearance programs, many Americans paused their debt repayments during the pandemic. For context, the U.S. Department of Education reports loans eligible for CARES Act forbearance as ‘current.’
To that point, TransUnion found that 58% of Americans that enrolled in financial hardship programs during the pandemic increased their VantageScore. Moreover, when TransUnion analyzed the improved credit scores of 1.3 million Americans that participated, it found that short-term involvement resulted in the best credit performance.
For example:
- TransUnion found that 58% of Americans that enrolled in financial hardship programs during the pandemic increased their VantageScore.
- Americans that exited hardship programs early demonstrated a 4.8% delinquency rate (30+ days past due) in the six months after obtaining a new bank card in the fourth quarter of 2020.
- Americans that remained in hardships programs demonstrated a 4.9% delinquency rate during that same timeframe.
- Americans that avoided hardship programs showed a 5.1% delinquency rate during that same timeframe.
Also noteworthy, for Americans at or below a prime plus VantageScore (721-780), those that exited hardship programs outperformed those that remained. Conversely, the hardship mainstays exceeded those leaving the programs for Americans with a super-prime VantageScore (781-850). All in all, TransUnion found that 54% of Americans improved their credit scores from Q1 to Q3 2020.
How Do FICO Scores Differ From VantageScores?
Often interchangeable, FICO Scores and VantageScores are used to determine your creditworthiness. In a nutshell: the credit-scoring models determine the likelihood that you will miss a debt payment by 90 days or more within the next two years.
Also, while FICO gathers data from credit bureaus, VantageScores are generated from consumer credit filings. However, many of the same inputs help calculate your final score:
- Payment history
- Length of credit history
- Types of credit
- Credit usage
- Recent inquiries

Despite that, FICO is the industry leader, and FICO Scores are used extensively by lenders. For your reference, here is a list of the most popular credit-scoring models.
| Credit-Scoring Model: | Score Range: |
|---|---|
| Credit-Scoring Model:Generic FICO Score | Score Range:300 – 850 |
| Credit-Scoring Model:Equifax Risk Score | Score Range:280 – 850 |
| Credit-Scoring Model:TransRisk | Score Range:300 – 850 |
| Credit-Scoring Model:VantageScore 1.0 & 2.0 | Score Range:501 – 990 |
| Credit-Scoring Model:VantageScore 3.0 | Score Range:300 – 850 |
| Credit-Scoring Model:PLUS Score | Score Range:330 – 830 |
| Credit-Scoring Model:Experian National Equivalency Score | Score Range:360 – 840 |
How Does My Credit Score Impact My Loan Interest Rate?
Now let’s talk about what your credit score actually means for you. Let’s start with how your credit score impacts your personal loan rates.When applying for a loan, the first lender step is to check your credit score.While many other variables are considered, your credit score plays an important role in determining the loan terms, and most importantly, the cost of borrowing.The below table shows the average interested rate people should expect based on their credit score.At the end of the scale, borrowers with too low credit scores often face diminishing prospects when obtaining a personal loan. As a result, they get payday loans, which average at 400%, and auto title loans, which average 300%.Tips from us! Avoid payday loans and auto title loans. On our site, you will find many alternative options, even if you are with bad credit.In addition to these high values of APR that we show, consumer studies also show:
- Roughly 20% of people who get auto title loans end up losing their car.
- The average American debt cycle is 200 days.
How Does My Credit Score Impact My Credit Card Interest Rate?
Cut from the same cloth, a stable and reliable credit score will also benefit you when it comes to credit card applications. As an unsecured form of borrowing, lenders are wary of extending large credit limits to high-risk borrowers.As such, maintaining a respectable score will not only lower your annual interest rate – but also allow you to qualify for options with higher minimum balances, lower annual fees, and greater rewards as well.
How Have Credit Score Factors Changed Over The Last 10 Years?
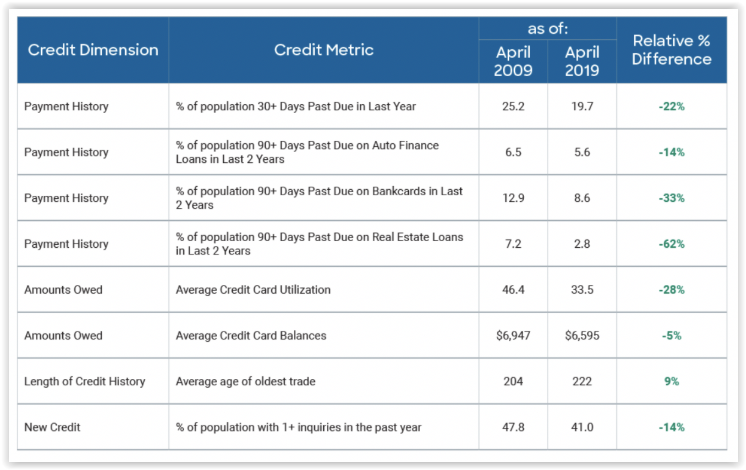
Do you know about this graph?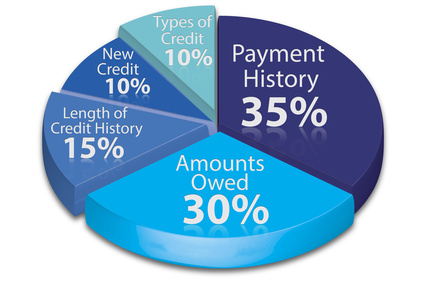 Probably yes. You’ve seen graphs like this one many times.But let’s now dig into what is behind these details and give you more advanced information on how these percentages change over the last 10 years. Here it is.
 Why Does The Average Credit Score Continue Growing?
- People are becoming more credit smart
More Americans started to understand that their FICO scores significantly impact their finances. As a result, they started to pay more attention to it and work on improving it.
- Missed payments reported in the credit file are down
Data shows that as of July 2020, 7.3% of the population had a 90+ day past due missed payment in the past 6 months. Credit reports to all of those people have been affected.Payment history makes 35% of your FICO score.
- The FICO Score doesn’t negatively consider forbearance/deferment agreements
Accounts reported as “current” with credit reporting codes related to forbearance or deferment or that the consumer has been affected by a disaster will not cause the FICO Score to drop. In fact, placing a consumer in forbearance or deferment and reporting the account status as “current” instead of “delinquent” will permanently ensure that the late payments won’t impact their FICO Score.
This should be great news to the millions of consumers holding accounts that have been reported in some form of a payment accommodation.
How We Conducted This Study
ElitePersonalFinance always has up-to-date studies.
Our goal is to consolidate the information and present the findings in a way that’s easy to understand by parsing through the latest data from FICO, Equifax, Experian, and TransUnion. If you enjoyed the study, please provide your feedback. Moreover, if there is anything that we missed or anything that you believe needs updating, please let us know, and we will respond promptly.
Sources
New York Fed Household Debt and Credit Report
Experian 10 States With the Highest Bankruptcy Rates
Average U.S. FICO Score by Age
Median Equifax Risk Score by Income
Consumer Financial Protection Bureau (CFPB) Study
Average VantageScore by Gender
TransUnion on Financial Hardship Programs
Archives
Average FICO Score by State 2021